Environmental Prediction in the Gulf of Maine
Forecast of North Atlantic right whale births
Summary: Using NAO, slope water, and food supply to forecast right whale births
Research by Andrew Pershing (Cornell University) and his colleagues has shown that three environmental factors can be used to forecast the birth rate of the North Atlantic right whale:
(1) natural climate variation called the North Atlantic Oscillation (NAO),
(2) ocean water entering from the continental slope into the Gulf of Maine through the Northeast Channel, and
(3) abundance of the right whale's primary food, Calanus plankton.
There is a time lag of one to two years between each step in the "chain reaction" connecting these three factors. By developing mathematical models that describe each step, the scientists created a system to forecast right whale births at least two years in advance. Together, the models offer a framework for understanding how the Gulf of Maine ecosystem functions. GoMOOS Buoy N in the Northeast Channel provides data that allow accurate forecasts and improved understanding of ecosystem changes in the Gulf of Maine. Sign up to get new right-whale calving forecasts by email.
The relationship between NAO, slope water, food supply, and right whale births is as follows.
| NAO index: | Slope water: | Food supply: | Right whale births: |
|---|---|---|---|
 |
|||
| Strongly negative | |||
| Negative |  |
||
| Positive |  |
||
| Strongly positive | |||
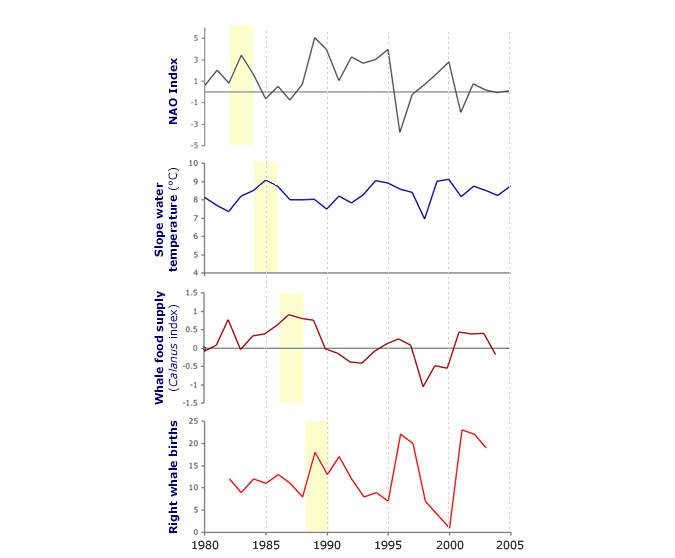
Time lags in "chain reaction" enable forecasting
Each step in the "chain reaction" from NAO to whale births has a delay of at least one year. Changes in the NAO are not reflected in slope water temperature until approximately one year later. Then, changes in the slope water do not affect the whales' food supply of Calanus plankton until another year has passed. Finally, the food supply influences the number of right whale calves in one or two subsequent breeding seasons. These time lags enable scientists to forecast the number of right whale births. By using water temperature data from GoMOOS Buoy N in the Northeast Channel, scientists can forecast births two or more years in advance.
A sequence of the time lags is indicated in yellow on the graphs below. The yellow on the NAO index graph marks a peak that subsequently propagates to slope water temperature to whale food supply to right whale births. Additional examples can be seen in other years on these graphs, such as the extremely low NOA index in 1996 that eventually results in a severe drop in right whale births in 2000, when only one calf was produced.