|
Tracking chlorophyll concentration changes over time is
key to understanding trends in phytoplankton productivity and the
overall health of the marine food web. GoMOOS buoys measure optical
properties of ocean water to determine chlorophyll concentration in
units of either milligrams of chlorophyll per cubic meter (i.e., mg
chl/m3) or, equivalently, micrograms per liter (i.e., ug/L).
Three GoMOOS buoys (B, E & I) monitor plant biomass and
productivity in coastal waters within a few miles of shore. Each buoy
monitors two depths: 3 meters depth in the highly productive part of
the water column and 18 meters depth where productivity tends to be
lower because of reduced light levels.
Fall Bloom of 2002
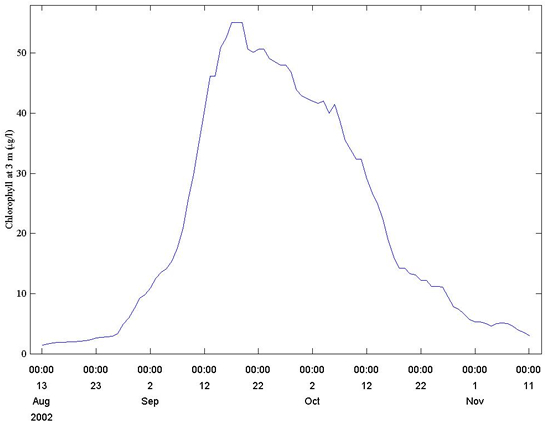
The plot below shows chlorophyll concentration at 3 meters depth from Buoy E. Notice the anomalously
large values during September and October 2002. This "fall bloom" of
phytoplankton typically occurs each year in the euphotic zone of the
Gulf of Maine. Precise timing of this event is hard to predict and has
implications for ecosystems and fisheries throughout the Gulf.
|
